The OpenOCD debugging Eclipse plug-in
Why a new plug-in?
By default, Eclipse supports OpenOCD via the GDB Hardware Debugging plug-in, which starts OpenOCD not as a separate daemon, but as a pipe end. This is functional, but restricts it even further.
Based on the experience with the J-Link plug-in, we decided to add a separate OpenOCD plug-in, with full configuration pages.
In early 2015, a step further was performed, with the addition of the GNU ARM Eclipse OpenOCD subproject, a new distribution of OpenOCD.
Unfortunately SWD support in the current OpenOCD version (0.8.x) is not that great, and we could not yet figure out a way to get the SWO tracing info out of OpenOCD, so currently there is no special tracing window available.
Prerequisites
Before being able to use any JTAG probe with OpenOCD, you must separately install:
- the GNU ARM Eclipse OpenOCD debugging plug-in
- the GDB debugger (client) application, as part of a GNU toolchain
- the OpenOCD as a GDB server
- any drivers required for the JTAG probe (for example FTDI drivers).
If you did not do it yet, please follow the instructions in the OpenOCD install page and return when completed.
The presence of a GDB as part of a GNU toolchain is mandatory, and it is recommended that the version of the GDB client matches the toolchain. Generally only debugging .elf applications is possible, and these applications must be compiled to include GNU compatible debugging information (like dwarf).
Non-GNU toolchains
Debugging applications generated by non-GNU toolchains (like the obsolete ARM CC), although not completely excluded, is not supported.
OpenOCD plug-in usage
Define the OpenOCD folder location
Before starting work with OpenOCD, it is recommended to define the path to the folder where OpenOCD executables are located.
-
in the Eclipse menu, go to (Window →) Preferences → Run/Debug → OpenOCD
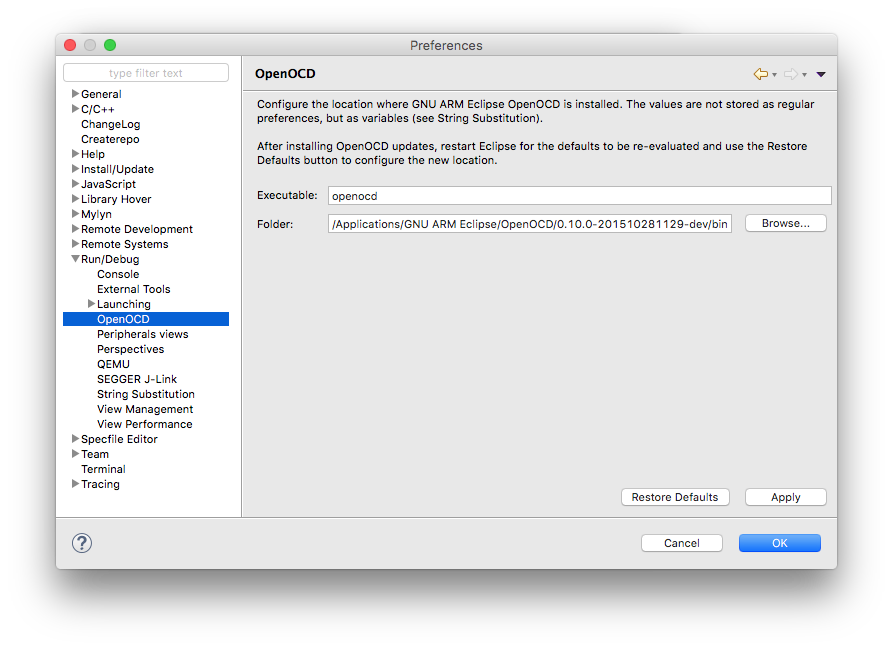
- click the Restore Defaults button
- the plug-in will suggest the default values computed when Eclipse started; if a new version of OpenOCD was installed while Eclipse was active, restart Eclipse and click again the Restore Defaults button
- check the Executable field; it must define the name of the command line OpenOCD executable; in most cases it should be set correctly; if not, edit it to match the correct name;
- check the Folder field; it must point to the actual folder where the OpenOCD tools were installed on your platform, for example
C:\Program Files\GNU ARM Eclipse\OpenOCD\binon Windows,/Applications/GNU ARM Eclipse/OpenOCD/bin/on macOS, or/opt/gnuarmeclipse/openocd/bin/on GNU/Linux - click the OK button
By default, the GDB server is defined as ${openocd_path}/${openocd_executable}; these two macros are automatically set by the above preference page; for portability reasons, it is recommended to define the path to the OpenOCD relative to this variable in all your debug configurations, to have a single place to update the path when you want to use another version of the OpenOCD tools installed in a different location.
Create the debugger configuration
Being a standard debugger, this plug-in also uses the Eclipse standard method of creating debugger configurations for each application. After you successfully build your application, you can create a new debug configuration following these steps:
- select the project (don’t skip it, this is important, see later)
- build it and ensure the executable file is available
- expand the Debug/Release folder and select the new executable file
- in the Eclipse menu, go to Run → Debug Configurations… or select the down arrow at the right of the bug icon
-
double click on the GDB OpenOCD Debugging group, or select it and click the top leftmost New button
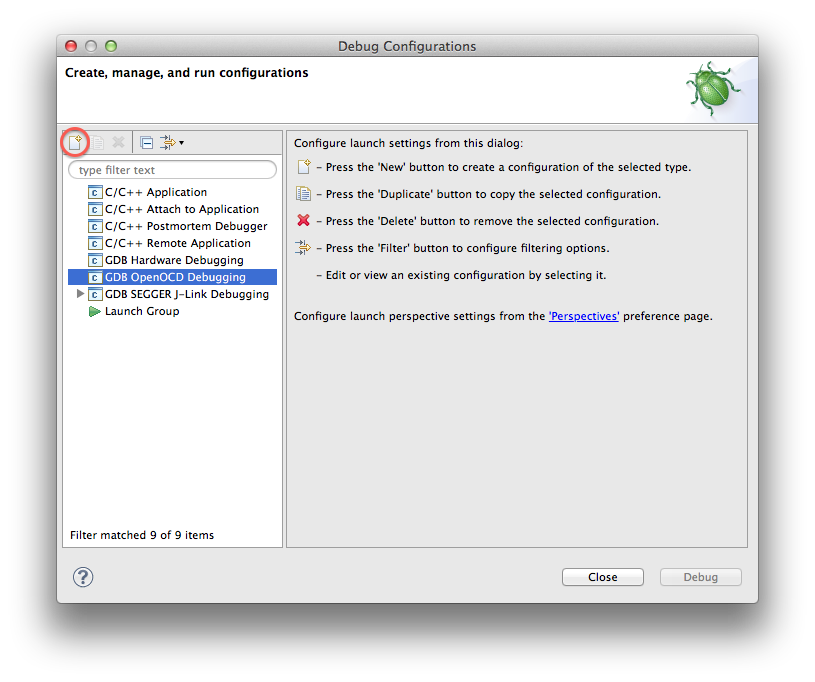
- a multi-tab page will be displayed
-
if you started this procedure with the executable file selected, the first tab, named Main, should be already filled in with the project name (for example blink1) and the application file name and location (for example
Debug/blink1.elf).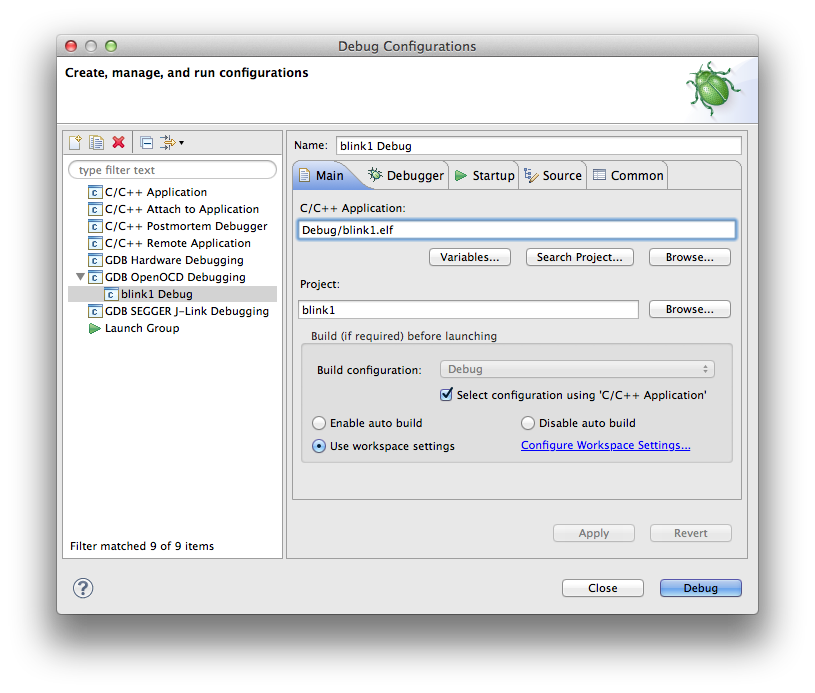
-
click the second tab, named Debugger, which contains the configuration options required to start the GDB server and the GDB client
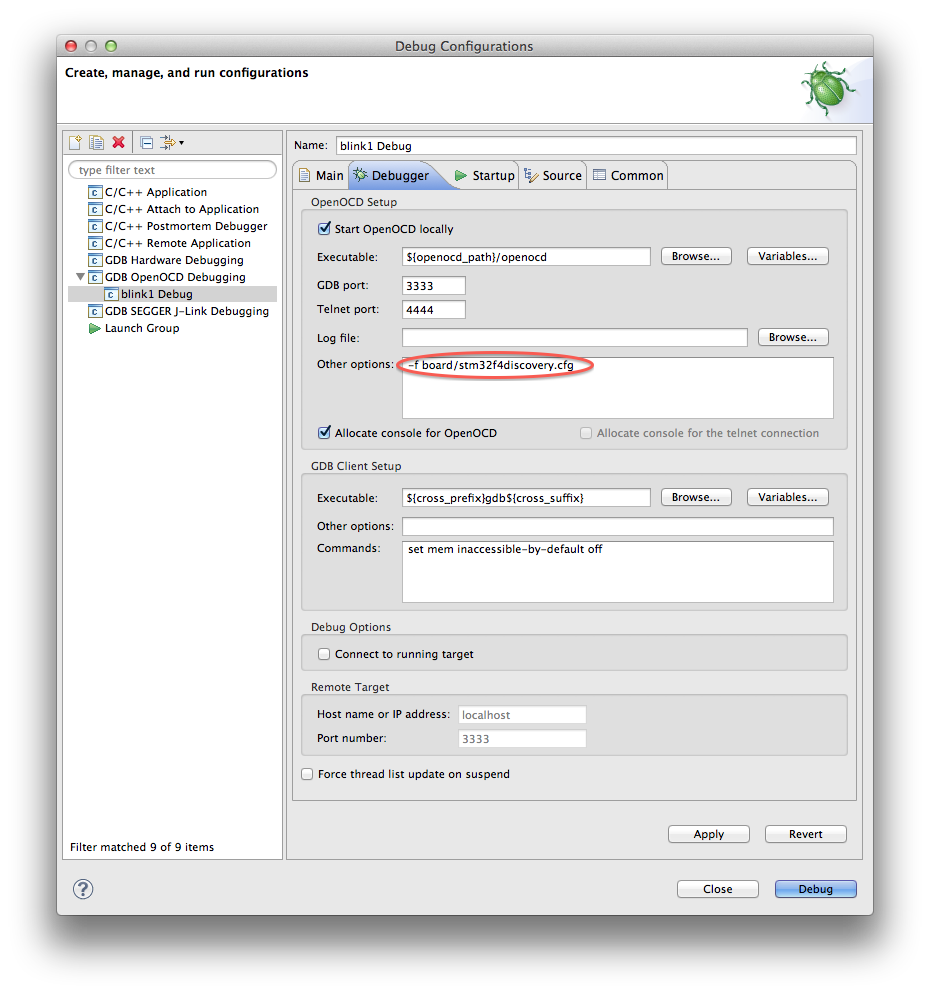
- the only field that usually requires attention is the OpenOCD Setup Other options:, where you should add one or more configuration scripts; for example, for the STM32F4DISCOVERY board, the field should read
-f board/stm32f4discovery.cfg
Note: it is mandatory to enter a reference to a configuration script here, otherwise the debug session will not start. Use the OpenOCD documentation for details on how to start OpenOCD for various boards.
- Windows notice: due to a platform specific issue, on Windows it is not possible to disable the Allocate console for OpenOCD
-
click the third tab, named Startup, which contains some specific OpenOCD options used to configure the debug session; defaults are generally enough
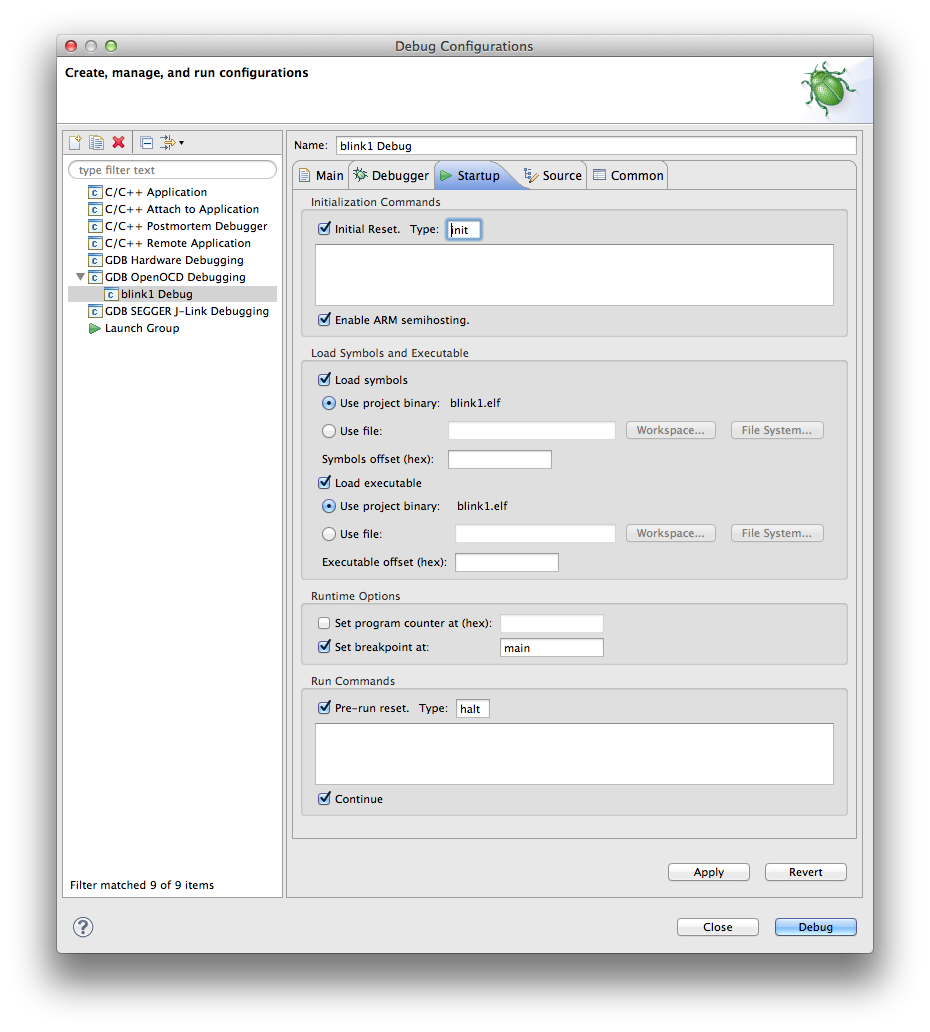
-
the order of sections/fields reflect the order commands are sent to GDB; for example the above generates:
monitor reset init monitor halt ... monitor arm semihosting enable symbol-file "/.../blink1/Debug/blink1.elf" load "/.../blink1/Debug/blink1.elf" tbreak main monitor reset halt monitor halt ... continue -
select the Common tab, set the Save as: field to Shared file and accept the current project name
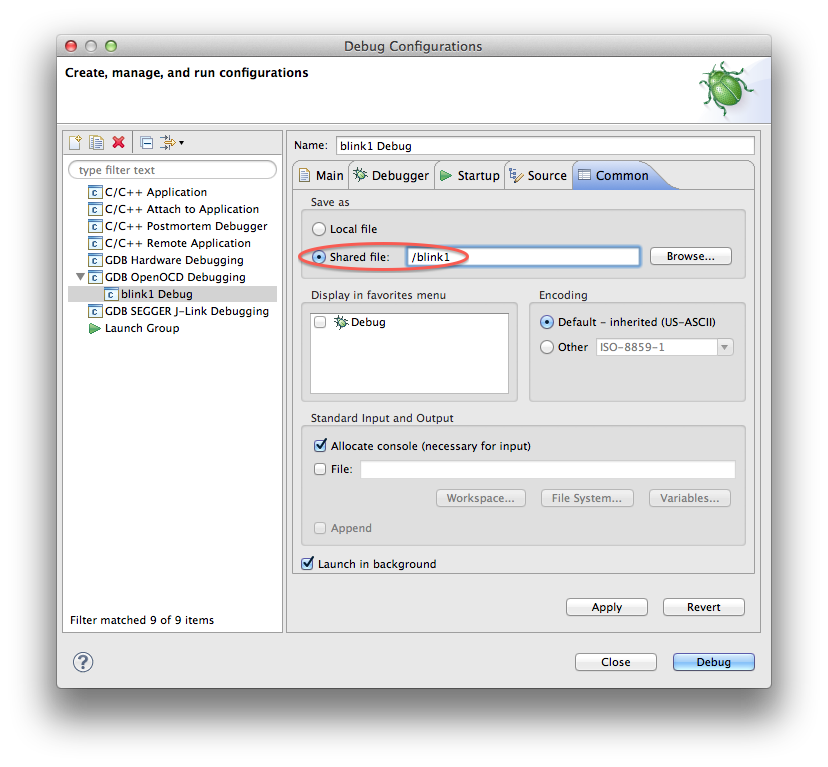
-
this will arrange for the debug configuration to be saved in the project, not in the workspace storage
- click the Apply button
- click the Close button
Start a debug session
Before starting a debug session, be sure that:
- the JTAG probe is connected to the computer; if the connection is via USB, use a high speed USB port, preferably directly to the computer, not via hubs which share the bandwidth with other traffic intensive devices, like disks, wi-fi, video cameras, etc.
- the wide JTAG flat cable is connected both to the JTAG probe and to the target device
- the target device is powered on
With all the above steps completed properly, you can start the debug session:
- in the Eclipse menu, go to Run → Debug Configurations…
- if necessary, expand the GDB OpenOCD Debugging group
- select the newly defined configuration
- click the Debug button
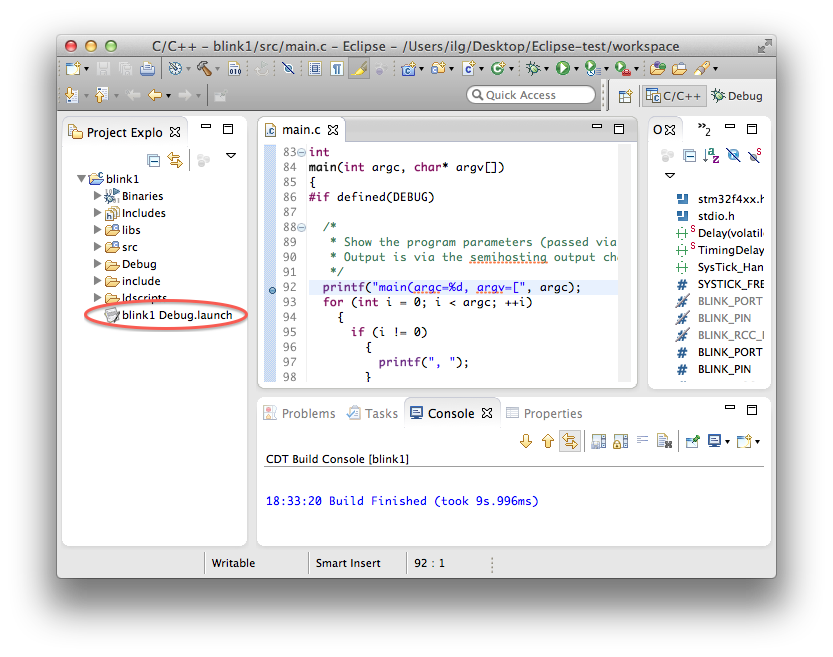
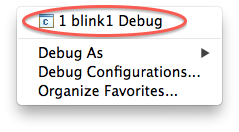
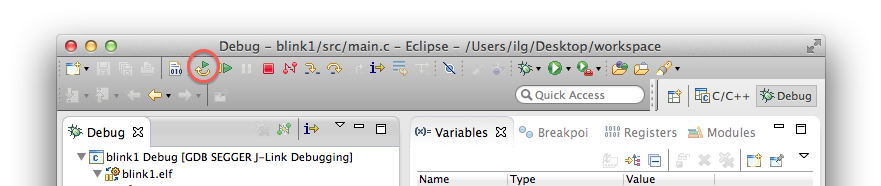
Alternatively, for later sessions, you can use the bug specific icon. Do not press it directly, since it will not behave as expected; instead, click the down arrow button:
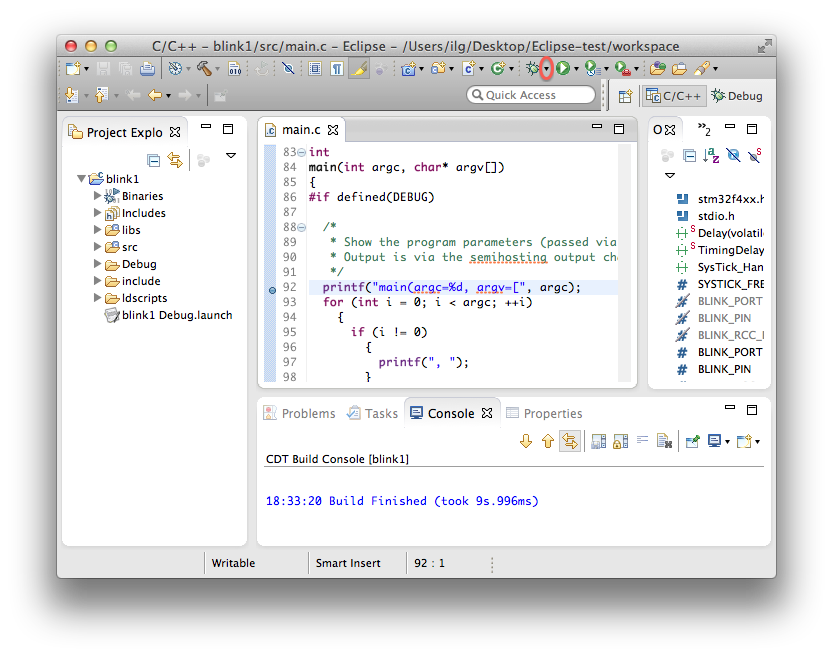
This will open a new window where you can select the desired debug configuration:
If everything is ok, after a few seconds required to start the server, to allow it to connect to the target, start the gdb client, download the application and start the debugging session, you should see something like this:
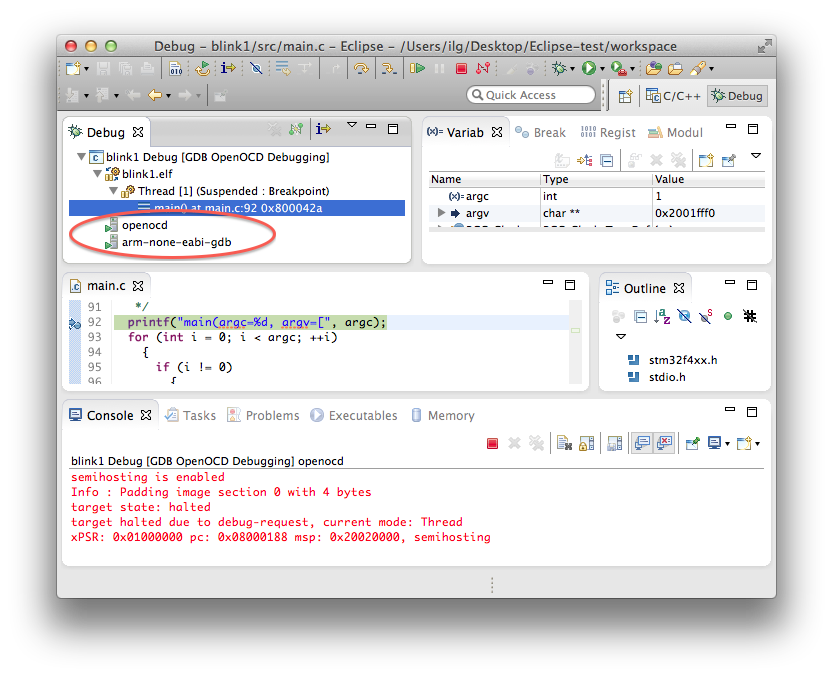
Since the first breakpoint was set in the Debugger tab to main, the execution stopped right at the beginning of the main() function, which in this case is a tracing printf().
Debug operations
Once the debug session started and execution stopped in the first breakpoint (by default set at the beginning of the main() function), you can perform any debug operation you need.
The most common operations are:
- single step over one source instruction (click the Step Over button)
- single step into the next function called (click the Step Into button)
- single step out of the current function (click the Step Return button)
- set breakpoints (click the grey side area at the left of the source lines)
- run (click the Resume button)
- halt a running program (click the Suspend button)
- inspect processor registers (use the Registers view)
- inspect memory (use the Memory view)
For more details please read the Running and debugging projects section in the Eclipse documentation.
View consoles
Each debug process has a dedicated console, to display its standard output and standard error, or to get input for the standard input.
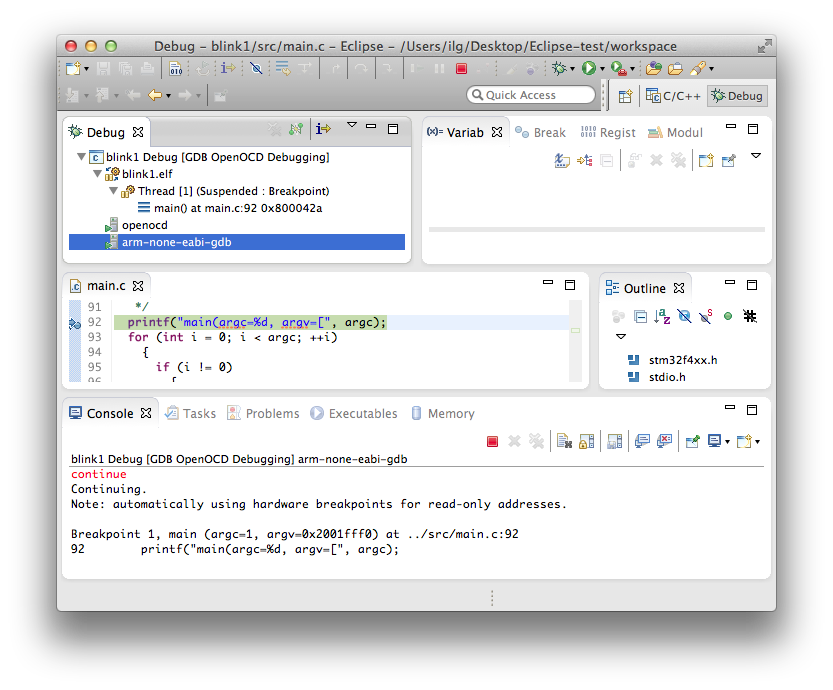
To see the console of any process, select the process in the top left window. For example the gdb client console might look like this:
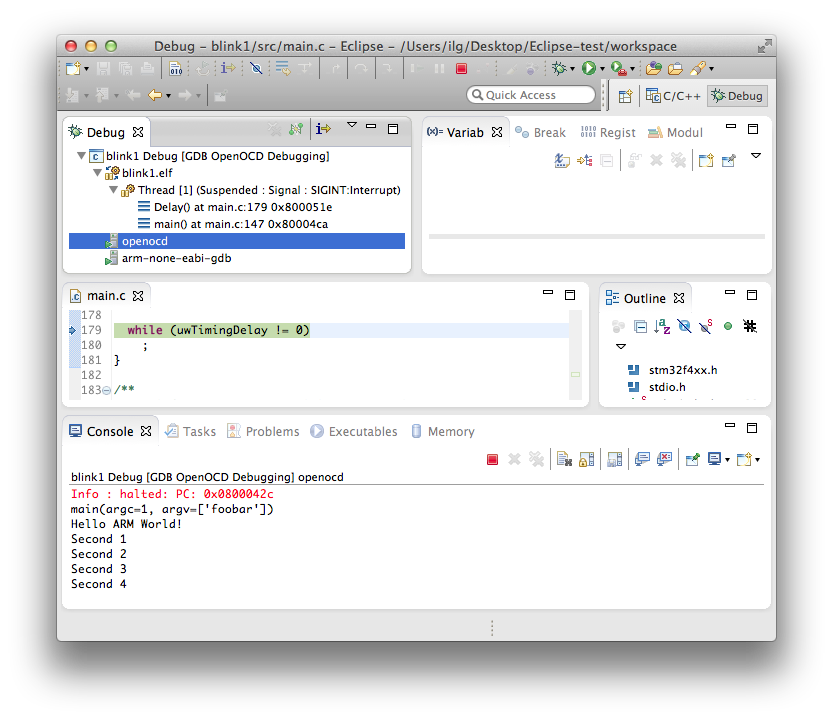
The semihosting tracing messages are displayed in the same window as the OpenOCD output:
Show console when standard out/error change
This is the default Eclipse behaviour when multiple consoles are active, to automatically switch to the latest updated. In our case, especially when the tracing console is also active, the focus will jump between windows, making things impossible to follow.
This mode can be identified by the status of the buttons on the right side of the Debugging view.
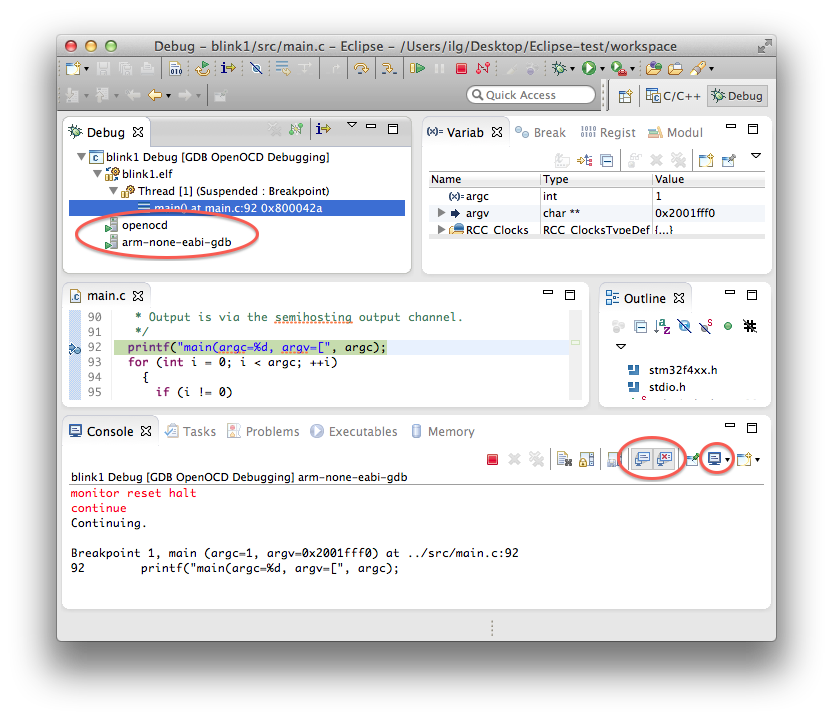
To make the display stable on the desired console, disable both buttons. To switch between consoles, select them either in the top left Debug view, or using the right button, as shown above.
The Restart button
Apparently not a big deal, but quite useful for repeated debug sessions, the Restart button can be used at any time during a debug session, and the result is that a reset is dispatched to the target board via the JTAG/SWD interface and the debug session is restarted.
Note: Due to some bugs in Eclipse, the implementation of his simple button has encountered several problems. Depending on the version you are using, the first time you click this button you might get a message box informing that the button was not enabled. Ignore this message, close the message box and click the button again, this time it’ll be effective.
Using a remote GDB server
If, for any reason, you need to run the GDB server on a remote machine (for example the development board is connected via OpenOCD to a machine in your office, but you are in another location), you can still use the plug-in to run debugging session. For this to work, just disable Start the GDB server locally in the Debugger tab and instead of localhost for the Host name or IP address, enter the name or address where the GDB server can be accessed.
Then you must manually start the OpenOCD process on the remote machine and only then you can start the debugging session.
Troubleshooting
Missing or wrong openocd_path
The first failure to start a debug session is missing to enter the OpenOCD path. Without it, the launching sequence will complain Cannot run program “/openocd”.
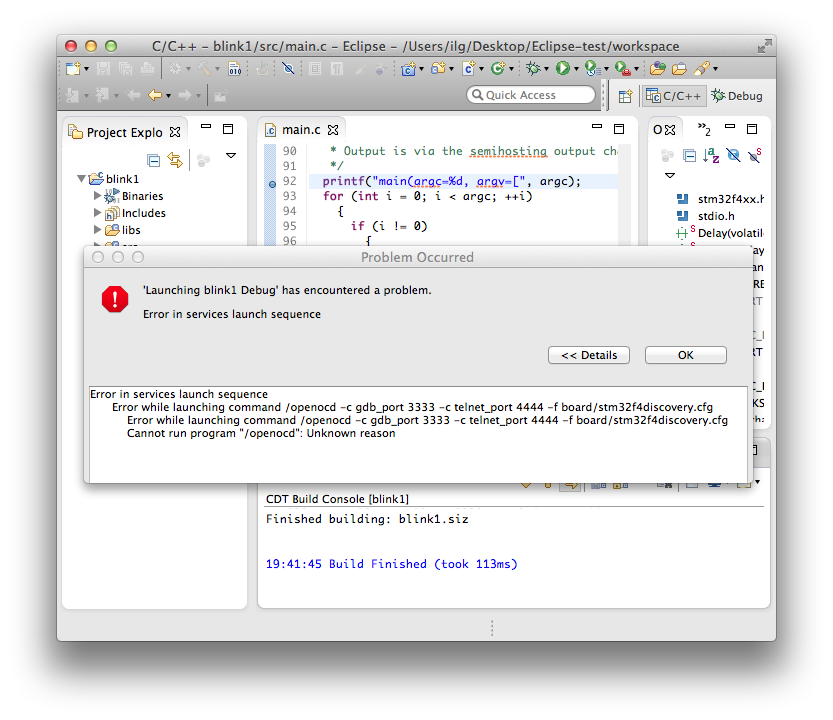
Define the openocd_path as instructed above and the session should start properly.
Wrong configuration selection
If the configuration files that you selected in the plug-in does not match the device physically connected, the OpenOCD starts, but remains in a confused state. The session does not start and usually requires to restart Eclipse.
Select the correct device and the session should start properly.
Start OpenOCD manually
If you still fail to configure the plug-in to start OpenOCD automatically, proceed as when using a remote GDB server, i.e. go to the Debugger tab and disable the Start OpenOCD locally, then start it manually in a separate terminal. Tweak the command line options until you get the right behaviour, and then retry the same options with the plug-in.
Quote the entire echo command
The syntax required by the OpenOCD echo command is a single string, in other words both echo and the message must be in the same string. To achieve this in a shell, the string must be quoted:
-c 'echo "Started by GNU ARM Eclipse"'
Note: this command is used by the plug-in to detect when the GDB server is initialised and ready to receive commands. It is not necessary when starting OpenCOD manually.
Chase for hanged OpenOCD processes
One usual error case is to retry a debug session while a previous OpenOCD is still active (either running or hanged, started by a previous run of the plug-in or manually). In this case the new OpenOCD has no chance to work, and the plug-in will most certainly fail, sometimes even without clear error messages.
Be sure you chase and kill all previous OpenOCD or GDB processes, using the system process inspector, before starting new debug sessions.
Compare with GDB Hardware Debugging
If you still cannot make it work, before filling any support tickets, please try to launch the debug session using the GDB Hardware Debugging plug-in, in the DSF launcher configuration (not the Legacy GDB Hardware Debugging Launcher). If you get the same behaviour, the problem is OpenOCD related (OpenOCD is notorious for subtle bugs), and cannot be fixed in the plug-in.
If the GDB Hardware Debugging plug-in works and the GDB OpenOCD debugging plug-in doesn’t, rerun both of them with the log enabled, on exactly the same executable, and compare the results. If you do not discover the problem, open a support ticket and attach the log files.
No GDB initialisation files loaded
For having a total control of the debugging session, the debugging plug-ins start the GDB client process with the --nx option, which prevents the execution of the commands found in any initialization file; none of the standard files (system.gdbinit, ~/.gdbinit, ./.gdbinit) are loaded.
To add more commands to the GDB initialisation sequence, use the Commands: field in the GDB Client Setup section.
All commands listed here are passed to the GDB client. By convention, commands prefixed with mon will be further passed from the GDB client to the GDB server, in this case the OpenOCD server.
Semihosting writes are very slow
Yes, unfortunately this is an OpenOCD limitation. Avoid writing to stderr, which is excruciatingly slow.
More details
Although the plug-in takes care of most of the configuration options, and provides reasonable defaults for the usual cases, it is recommended to read the OpenOCD manuals, available in the doc folder of your install location.
