Debugging
Contents |
Quicklinks
If you know all about debugging, and all you need is how to install/configure/use the debugging plug-ins, the direct links are below.
In short, for bare metal embedded development, we highly recommend solutions that can be used on all major platforms (Windows, macOS and GNU/Linux), with hardware probes that implement the SWD protocol and support tracing via the SWO pin. The preferred probes that match the above requirements are J-Link EDU/J-Link, from SEGGER.
- J-Link install
- J-Link plug-in usage
- OpenOCD install
- OpenOCD plug-in usage
- QEMU install
- QEMU plug-in usage
- The Peripherals registers view
Overview
Although it varies a lot depending on personal skills and experience, debugging can be one of the most time consuming activities during software development, and any solutions intended to address it are welcome.
Generally there are two approaches:
- manually stepping through the code to check the program flow and inspect various status variables
- letting the program run and automatically collect various tracing messages (like the traditional printf() calls) and/or execution events (enter/exit interrupt handlers, memory location change, etc)
To be noted that these approaches are not exclusive, but complement each other, since they better serve different purposes, and have specific advantages and disadvantages.
Manual stepping
Manually stepping through the code is great for debugging a standalone linear piece of code, to check if the implementation of an algorithm is correct, to detect off-by-one errors (accessing past the size of an array or collection). It is also useful to get an initial understanding of the functionality of a piece of code written by someone else. Its main drawback is severely distorting the time behaviour of the debugged code, which, if the debugged device is interacting with other external devices, will most likely trigger timeouts. For complex code, with multiple iterations and multiple processes, it is quite tedious, requiring a lot of manual interactions with the debugger to reach the desired point in time, especially when the sessions are expected to be restarted often.
The manual stepping approach generally requires a generic debugger and a specific method to connect it to the application to be debugged. The GNU toolchains provide a standard gdb command line tool to interact with the debugged application, and Eclipse provides various plug-ins to integrate the command line tool into the IDE.
The recommended way to connect gdb, running on the development machine, to the application, running on an embedded device, is to use a gdb server. If the debugged application is a GNU/Linux ARM application, running on an embedded device like BeagleBone or Raspberry, the gdb server must be first installed and started on it, then the gdb client needs to be instructed to connect via tcp/ip to it and start the debug session.
If the debugged application runs on a bare metal device, then it is necessary to use a physical probe, to load the device memory and to assist during the debugging session. The standard way is to use a JTAG or SWD probe, paired with a custom gdb server, able to talk to it on one side, and to accept the standard gdb commands on the other side.
Using trace messages
Collecting tracing messages and events, when used wisely, can be a valuable source of information regarding the flow of a complex application, with multiple interacting threads, being especially useful when the debug sessions are restarted often. Once the trace messages are added, the dynamic life of various threads/handlers can be seen with a simple view of the trace log. In addition to classical printf() messages that need to be manually inserted in the code, for embedded applications, modern ARM cores, including those in the Cortex-M families, provide special support for collecting hardware events, like accurate timestamps when an interrupt handler was entered/exited, when a memory location was accessed, and more.
Recognising the importance of these methods, the designers of the ARM families added special support, like the SWO (Serial Wire Output) pin in Cortex-M processors, or even more elaborate interfaces for larger ARM processors.
GDB
The tool used by GNU ARM Eclipse plug-ins for debugging is the ARM version of GDB, the venerable GNU debugging tool.
No initialisation files
For having a total control of the debugging session, the debugging plug-ins start the GDB client process with the --nx option, which prevents the execution of the commands found in any initialization file; none of the standard files (system.gdbinit, ~/.gdbinit, ./.gdbinit) are loaded.
To add more commands to the GDB initialisation sequence, use the Commands: field in the GDB Client Setup section:
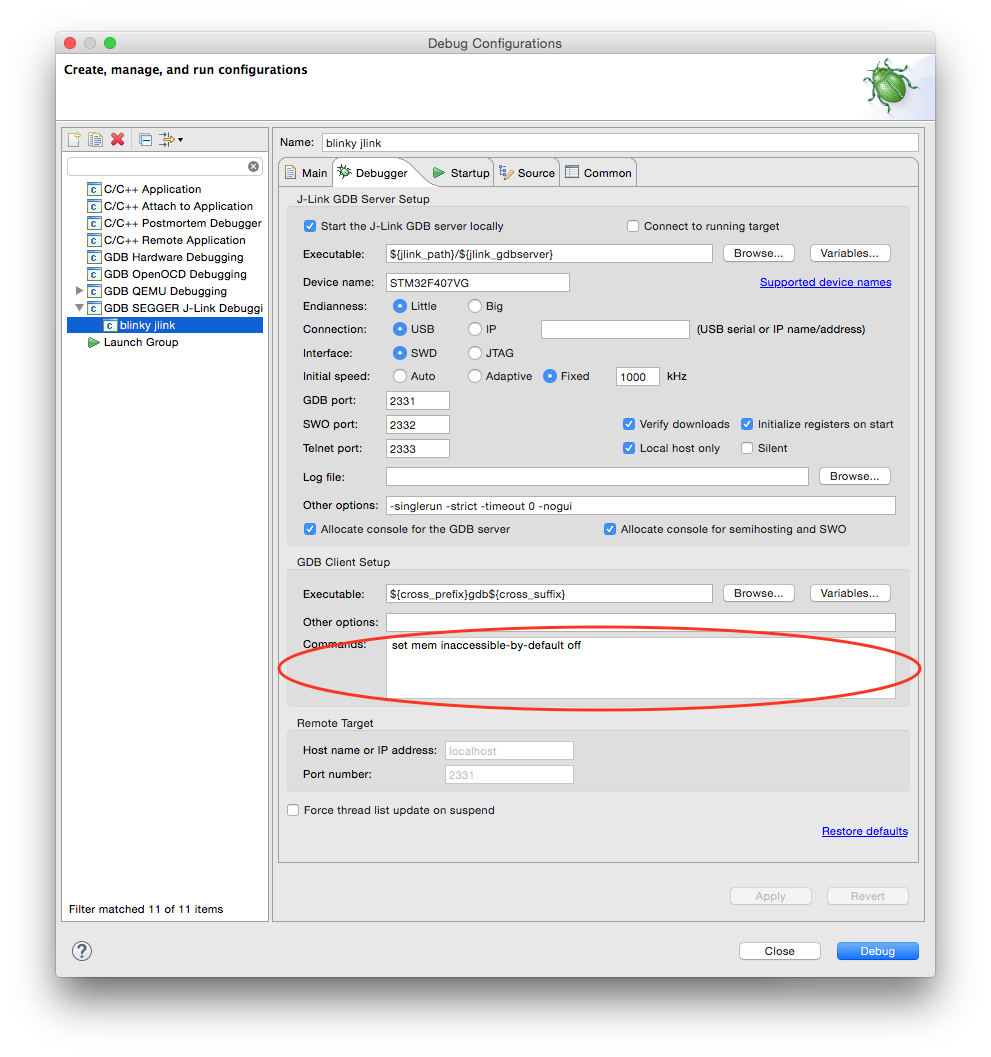
All commands listed here are passed to the GDB client. By convention, commands prefixed with mon will be further passed from the GDB client to the GDB server.
