How to install the debugging components?
Contents |
Quicklinks
If you know what you are doing, you can directly skip to:
Overview
When debugging ARM applications, generally two main components are required:
- a hardware JTAG/SWD probe
- several software components
The hardware probe can be either a separate device, connected via a flat cable to the debugged board, or, for many affordable discovery boards, can be directly integrated on the evaluation board, having a separate USB connector.
For several specific cases, the hardware probe is not mandatory, debugging being possible inside emulators, like QEMU.
As for software, debugging is generally a complex operation, and in Eclipse it requires multiple components:
- one or more Eclipse Debugging plug-ins
- the GDB debugger (client) application
- the GDB server application
- the hardware drivers required by the JTAG/SWD probe
The GNU ARM Eclipse project recommends three debugging solutions:
- the SEGGER J-Link probe & GDB server, as a highly professional solution, supporting both JTAG and SWD, plus SWO trace output;
- the OpenOCD application as an universal tool, supporting most cheap JTAG probes, but with limitations (currently it does not support SWD and implicitly no SWO, it is slower, configuration might be sometimes cryptical, there are many driver incompatibilities on Windows, etc);
- the GNU ARM Eclipse QEMU emulator, supporting several Cortex-M boards.
For an explanation why the SEGGER J-Link was selected, please go to the J-Link Debugging page and read the introduction section.
GDB client
The GDB client (GDB stands for GNU Debugger) is part of the GNU Toolchains, and is located in the same folder as all GNU toolchain binaries (compiler, linker, etc). The application name uses the same prefix/suffix as the compiler (for example, the debugger for embedded applications is arm-none-eabi-gdb).
To check if GDB is functional on your machine, use the following command (adjust the path for your system):
$ /usr/local/gcc-arm-none-eabi-4_7-2013q3/bin/arm-none-eabi-gdb --version
GNU gdb (GNU Tools for ARM Embedded Processors) 7.4.1.20130913-cvs
The presence of a GDB as part of a GNU toolchain is mandatory, and it is recommended that the version of the GDB client matches the toolchain version. Generally only debugging .ELF applications is possible, and these applications must be compiled to include GNU compatible debugging information (like dwarf).
Non-GNU toolchains
Debugging applications generated by non-GNU toolchains (like the obsolete ARM CC), although not completely excluded, is not supported.
GDB server & drivers
For the GDB server, there are three recommended solutions, J-Link GDB Server, OpenOCD and QEMU. Detailed installation instructions are available in separate pages:
Normally if you already have a J-Link probe (or an OpenSDA J-Link compatible evaluation board), there is no absolute need to install OpenOCD, but it is sometimes useful to have a back-up solution in case you want to compare different behaviours, so the recommendation is to have both installed.
Similarly, if you do not have a J-Link (yet), there is no need to install the J-Link support at this moment; you can very well start your tests with OpenOCD alone. However, especially if your evaluation board has an integrated JTAG, once you overcome the initial apprentice status and want to use more advanced debug techniques, like SWO traces, or even want to debug your own boards, you will need an external JTAG, and in this case the recommended solution is to use J-Link.
Alternate solutions
J-Link and OpenOCD are not the only existing solutions, but probably are the most portable ones. J-Link is a single piece of hardware that can be used with most ARM processors. At the other end of the spectrum is OpenOCD, a single piece of software that, within limits, can be used with most JTAG probes, especially on GNU/Linux.
If portability is not your concern, and you prefer other GDB servers, please feel free to use them, but GNU ARM Eclipse plug-ins do not provide support from them.
To save you time, we compiled a list of other GDB servers, with some of their features and limitations:
- the original STM32 ST-Link Utility software, available from STM as part number STSW-LINK004, also implements a GDB server for the ST-LINK probes; runs on Windows only
- the stlink GDB server from texane, a GitHub project, implements the ST-LINK protocol; can be compiled from sources on GNU/Linux and macOS; on Windows can be compiled using Cygwin
- the CooCox GDB server; supports multiple JTAG probes; runs on Windows only
- the Atollic GDB server, part of the Atollic suite; the server seems to start separately, but attempts to connect to it fail, probably due to some protection checks
OpenSDA
Another interesting solution is Freescale’s OpenSDA debug/programming interface. For the Kinetis L based Freedom Development Boards, SEGGER provides a high performance OpenSDA implementation fully compatible with the J-Link Lite, so the J-Link plug-in can be successfully used for these evaluation boards without having a physical J-Link probe. More details on installing OpenSDA can be found on MCU on Eclipse.
Eclipse debugging plug-ins
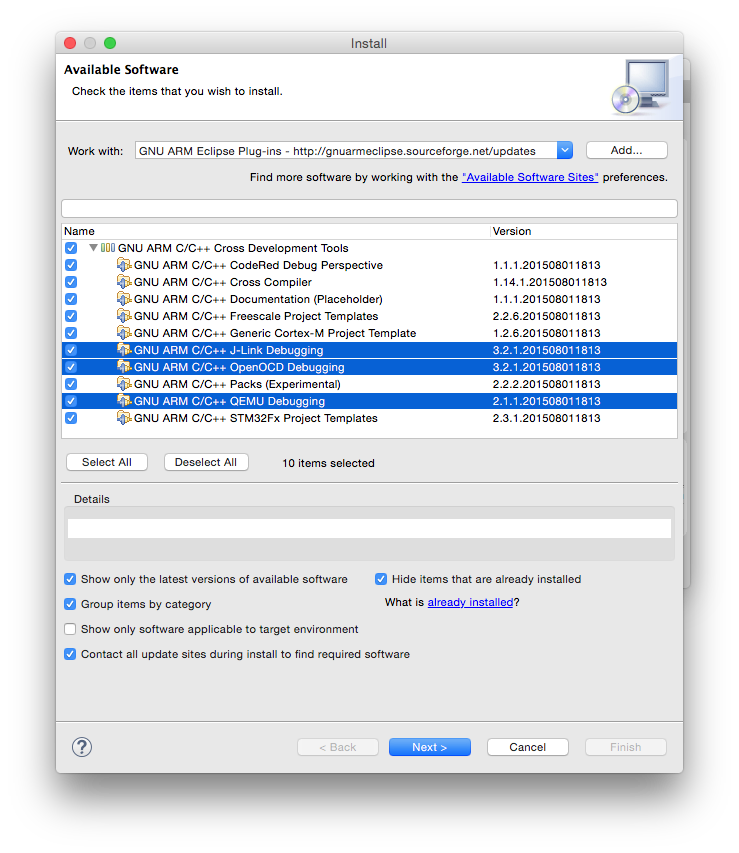
The debugging plug-ins come together with the other GNU ARM Eclipse plug-ins, and should be installed in the same step, detailed in the plug-ins install page.
Be sure you enable the entries named GNU ARM C/C++ J-Link Debugging, GNU ARM C/C++ OpenOCD Debugging and GNU ARM C/C++ QEMU Debugging.

Specific plug-in usage documentation is available from separate pages:
