The J-Link debugging Eclipse plug-in
Quicklinks
If you already know what are the features of the new plug-in and only want to know how to install/use it, you can directly skip to:
Why a new plug-in?
Until now, debugging with the J-Link probe in Eclipse was done via the GDB Hardware Debugging plug-in. For experimental projects it was more or less ok, but for serious development it was quite tedious. The missing features, that were added to this plug-in, are:
- transparent integration of the GDB server, automatically started/stopped for each debug session
- advanced graphical user interface to configure most GDB client and GDB server SEGGER specific options
- transparent integration of the semihosting and Serial Wire Viewer (SWV) window as a standard Eclipse console
- a functional restart button, to reset the target and restart the debugging session, without having to rewrite the executable image
- direct use of project toolchain definition (prefix, suffix, path) to simplify configuration of the GDB client
- macro based J-Link folder path definition, for simplified management of the GDB server location when upgrades to new SEGGER versions are released
- support for SWO registers configuration to match a given system clock frequency
Prerequisites
Before being able to use the J-Link probe with the GNU ARM Eclipse plug-ins, you must separately install:
- the J-Link debugging plug-in
- the GDB debugger (client) application, as part of a GNU toolchain
- the SEGGER J-Link GDB server and drivers.
If you did not do it yet, please follow the instructions in the J-Link install page and return when completed.
The presence of a GDB as part of a GNU toolchain is mandatory, and it is recommended that the version of the GDB client matches the toolchain. Generally only debugging .elf applications is possible, and these applications must be compiled to include GNU compatible debugging information (like dwarf).
Non-GNU toolchains
Debugging applications generated by non-GNU toolchains (like the obsolete ARM CC), although not completely excluded, is not supported.
J-Link plug-in usage
Define the J-Link folder location
Before starting work with the J-Link tools, it is required to define the path to the J-Link folder.
-
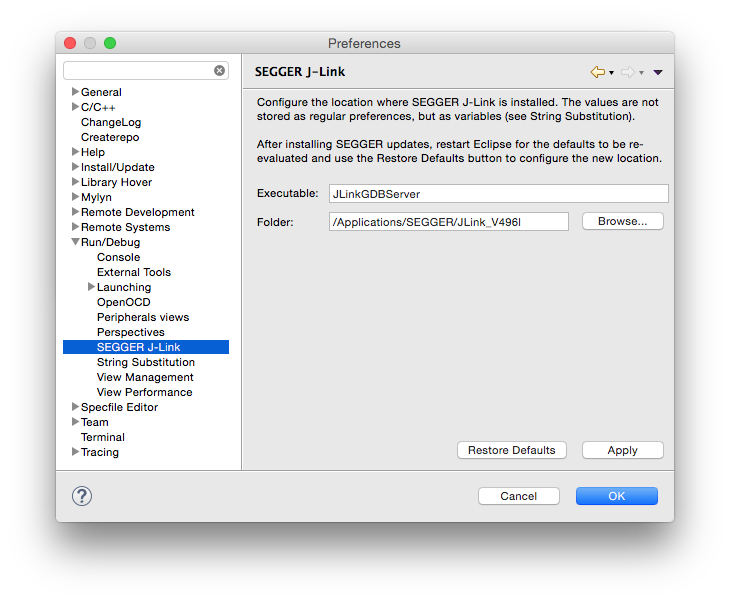
in the Eclipse menu, go to (Window →) Preferences → Run/Debug → SEGGER J-Link
- click the Restore Defaults button
- the plug-in will suggest the default values computed when Eclipse started; if a new version of SEGGER was installed while Eclipse was active, restart Eclipse and click again the Restore Defaults button
- check the Executable field; it must define the name of the command line J-Link GDB server executable; in most cases it should be set correctly; if not, edit it to match the correct name;
- check the Folder field; it must point to the actual folder where the J-Link tools were installed on your platform, for example
/Applications/SEGGER/JLink_V614bon macOS - click the OK button
- Windows warning: please note that on Windows there are two GDB server executables, one with a UI and one to be used as a command line (
JLinkGDBServerCL.exe); you obviously need to configure the executable field to point toJLinkGDBServerCL.exe.
By default, the GDB server is defined as ${jlink\_path}/${jlink\_gdbserver}; these two macros are automatically set by the above preference page; for portability reasons, it is recommended to keep this definition in all your debug configurations, and also to have a single place to update the path when a new version of the J-Link tools is released.
Associate a device to the project
Although not absolutely mandatory, it is recommended to associate a device to the project, so that creating the debugger launch configuration will automatically fill-in the device name.
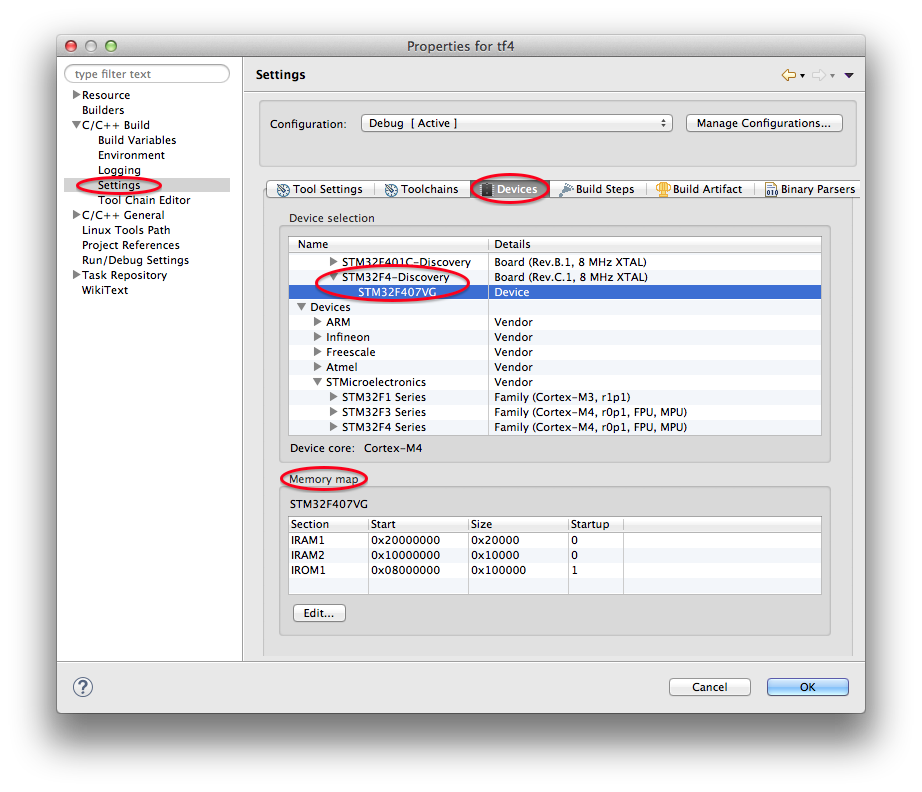
Follow the steps in the separate page Associate a device to the project and return to this page to continue.
Create the debugger launch configuration
Being a standard debugger, this plug-in also uses the Eclipse standard method of creating debugger configurations for each application. After you successfully build your application, you can create a new debug configuration following these steps:
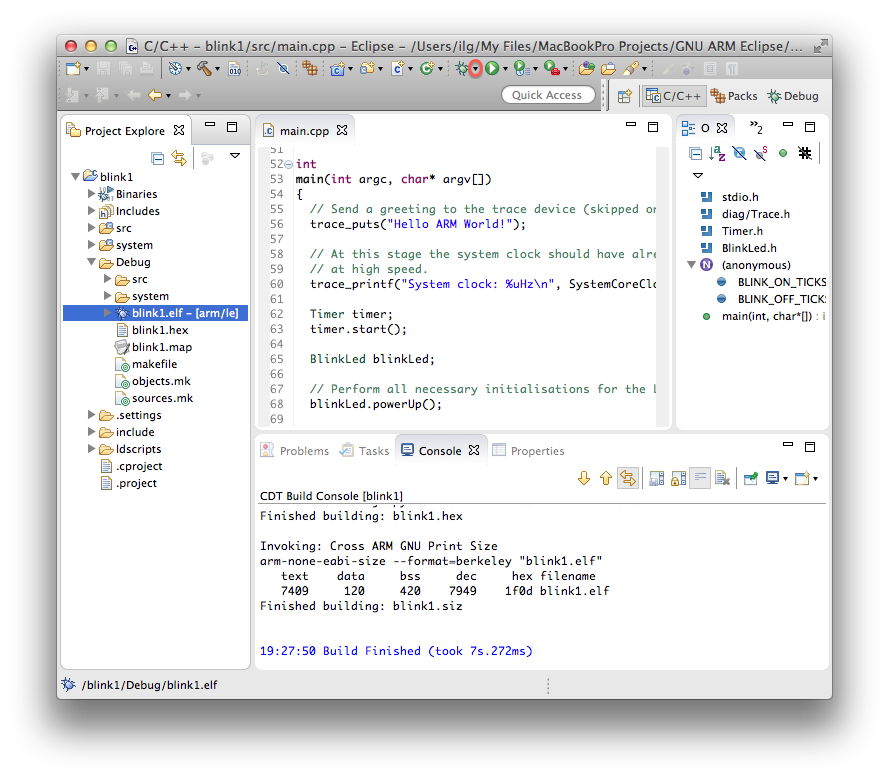
- select the project
- build it and ensure the executable file is available
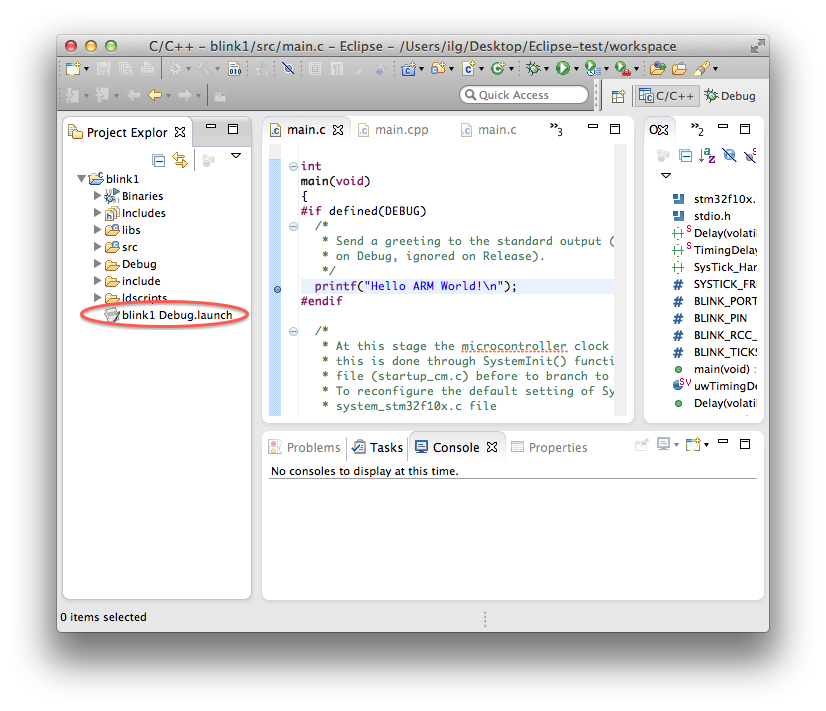
- expand either the Debug or the Release folder and select the executable you want to debug
-
in the Eclipse menu, go to Run → Debug Configurations… or select the down arrow at the right of the bug icon.
-
double click the GDB SEGGER J-Link Debugging group, or select it and click the top leftmost New button.
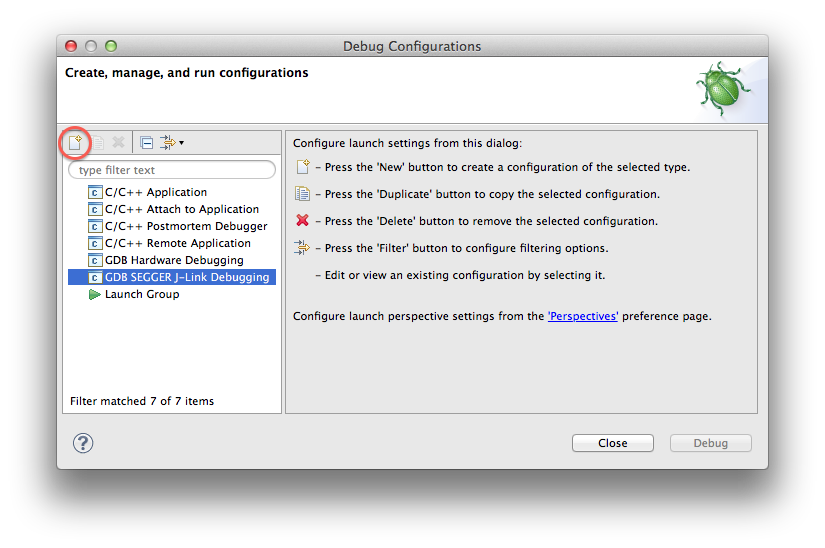
- a multi-tab page will be displayed;
-
if you started this procedure with the project selected and the project was previously built, the first tab, named Main, should be already filled in with the project name (for example blink1) and the application file name and location (for example
Debug/blink1.elf).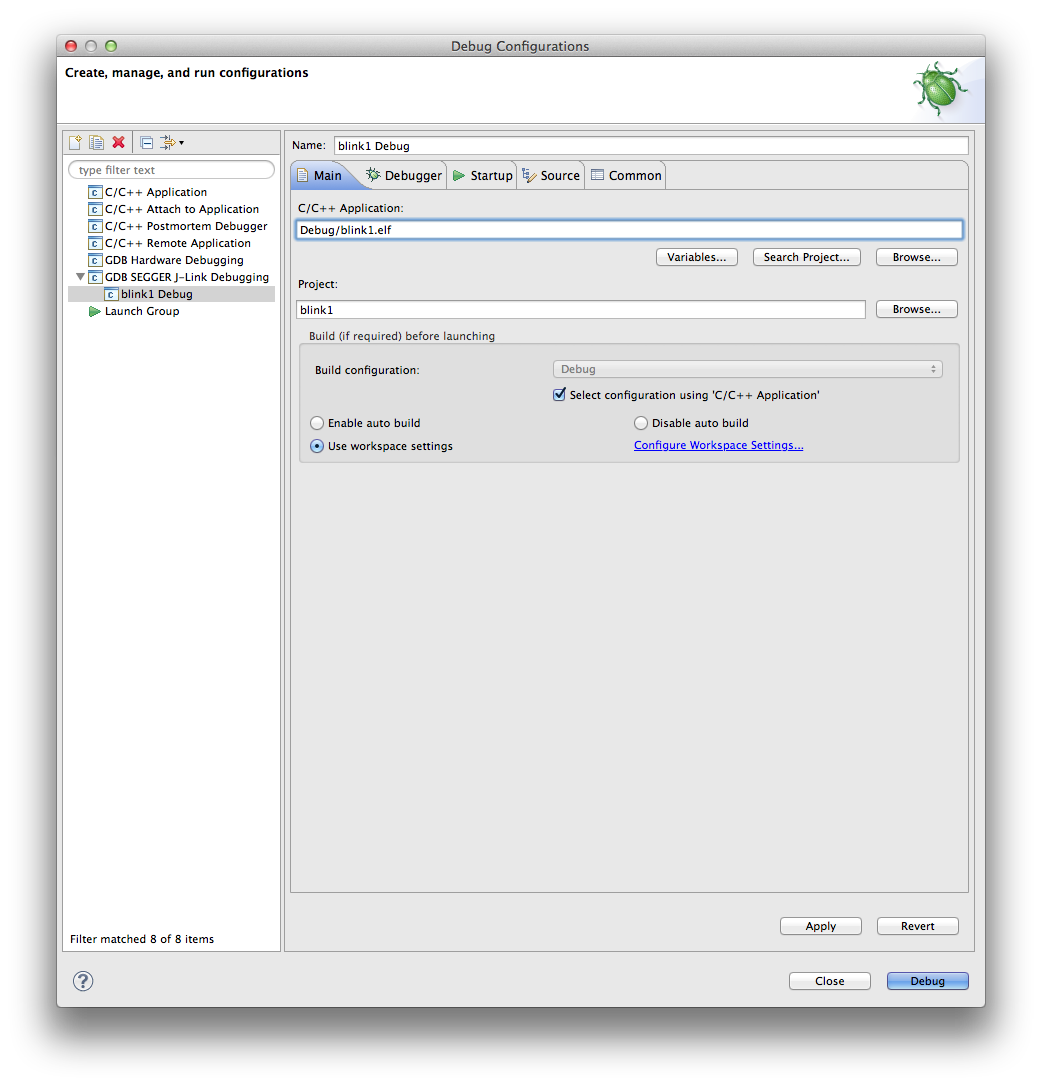
-
click the second tab, named Debugger, which contains the configuration options required to start the GDB server and the GDB client.
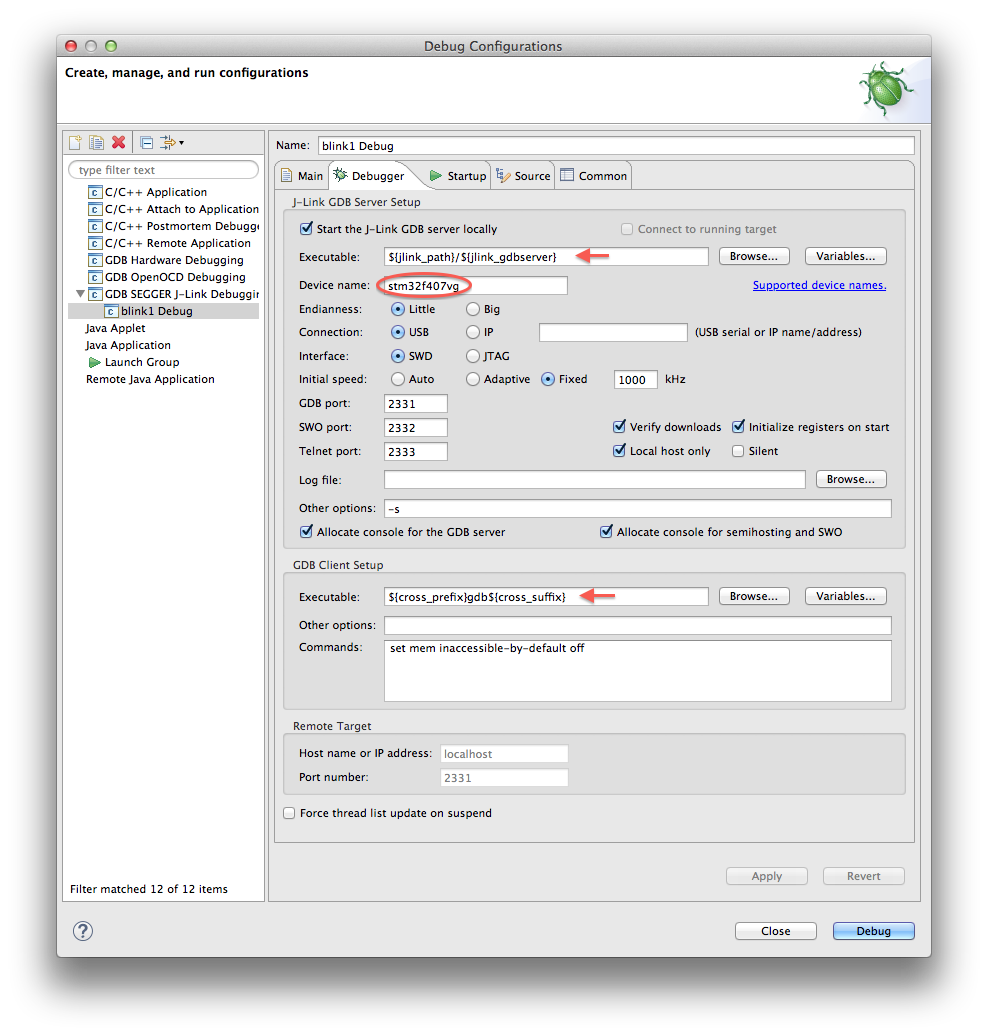
- the only field that usually requires attention is the Device name, which must identify the processor family; if you assigned the device to the project, this field is automatically filled-in; usually this name is the family name; if you do not know it for your processor, follow the link at the right and copy/paste the string from the SEGGER web page;
- for portability reasons, the GDB server and GDB client executables are defined using variables; it is highly recommended to keep these definitions;
- the
${cross_prefix}and the${cross_suffix}variables are defined automatically using the toolchain definitions; unless you are debugging a project-less ELF, leave them as is; - the values of the
${jlink_path}and${jlink_gdbserver}can be manually edited in the Eclipse menu → (Window →) Preferences → Run/Debug → SEGGER J-Link configuration page (if you do not find this page, upgrade the plug-ins); - the Connect to running target option allow to start a debug session without performing any reset or program download, so that the target will continue to run unaffected, until explicitly halted by the debugger (Note: this option requires the latest plug-in and SEGGER versions);
-
click the third tab, named Startup, which contains specific J-Link options used to configure the debug session.
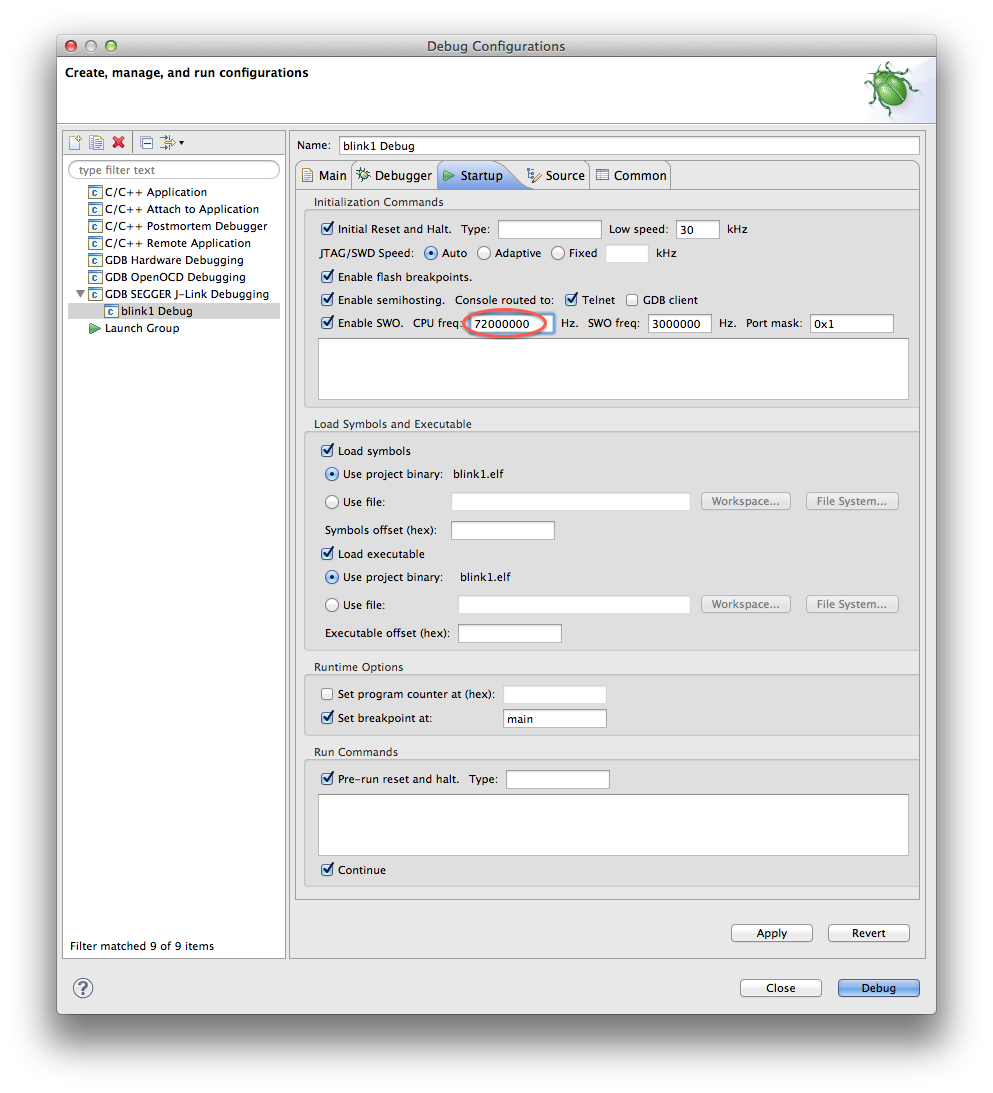
- if you built the project with retargetting support for ITM/SWO, enter the CPU frequency and the desired SWO sampling frequency; for this to work with J-Link, the SWO sampling frequency must be a submultiple of 6MHz (6000000, 3000000, 2000000, 1500000, 1000000, etc) and the CPU frequency must be a multiple of the SWO sampling frequency (these apparently very complicated requirements end up as a pre-scaler value in an ARM register);
- for most applications running from flash, leave the Pre-run reset and halt enabled, this will issue a new reset after programming the flash and just before starting execution. Due to some complicated technical details, when the debugger tries to reset some cores, execution cannot be halted immediately, and part of the initialisation routine is executed. Then the flash is written with the new application, it is not correct to directly start execution, since part of a foreign initialisation sequence, that is not part of the current application, was executed; to be sure the application starts correctly, it is necessary to issue a new reset. Please note that this does not apply for applications running from RAM, since the reset may damage the RAM content;
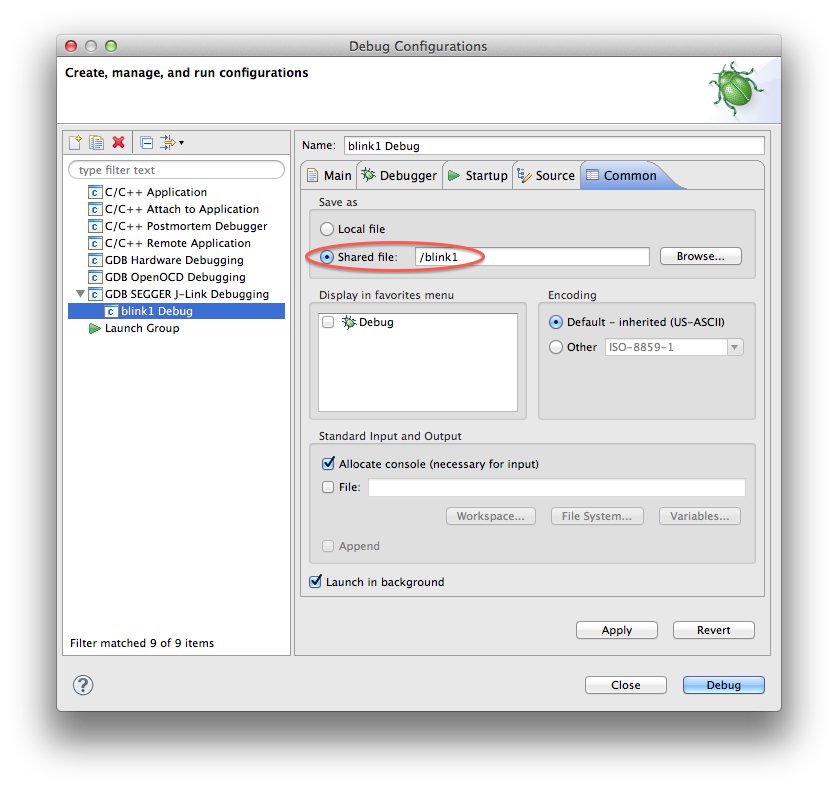
- although not mandatory, it is recommended to change the location where the launcher file is stored; for this,
- select the Common tab,
- set the Save as: field to Shared file
- accept the current project name.
- click the Apply button
- click the Close button
With the above settings, the debug configuration will be saved in the project, not in the workspace storage.
Start a debug session
Before starting a debug session, be sure that:
- the J-Link debugger is connected to a high speed USB port, preferably directly to the computer, not via hubs which share the bandwidth with other traffic intensive devices, like disks, wi-fi, video cameras, etc.
- the wide JTAG flat cable is connected both to the J-Link and the target device
- the target device is powered on
With all the above steps completed properly, you can start the debug session:
- in the Eclipse menu, go to Run → Debug Configurations…
- if necessary, expand the GDB SEGGER J-Link Debugging group
- select the newly defined configuration
- click the Debug button
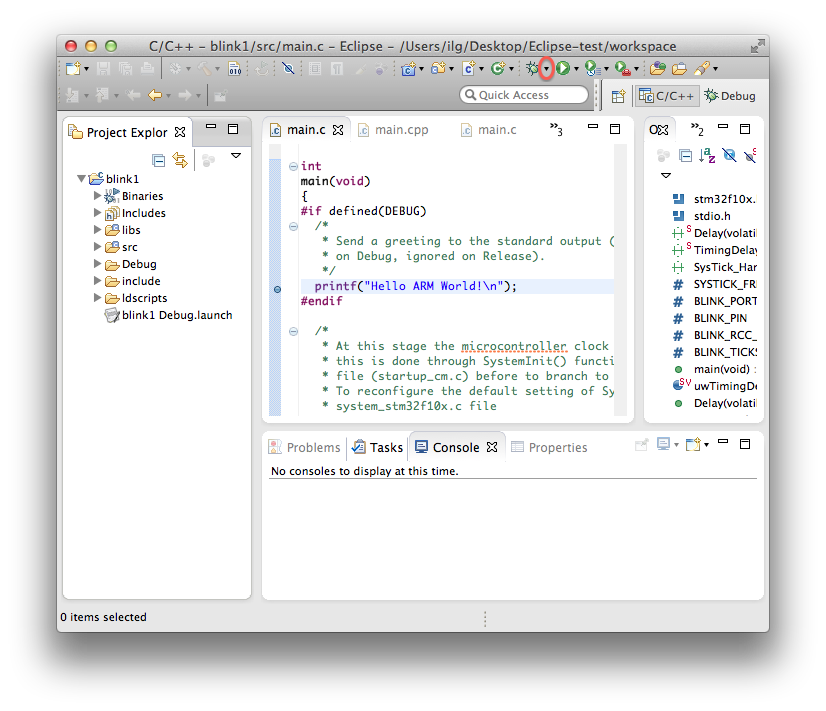
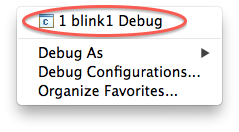
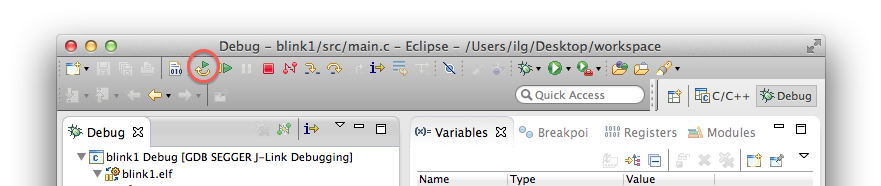
Alternatively, on subsequent runs, you can use the bug specific icon. By default this will start the previously used debug launch configuration; to start a different configuration, use the down arrow button:
This will open a new window where you can select the desired debug configuration:
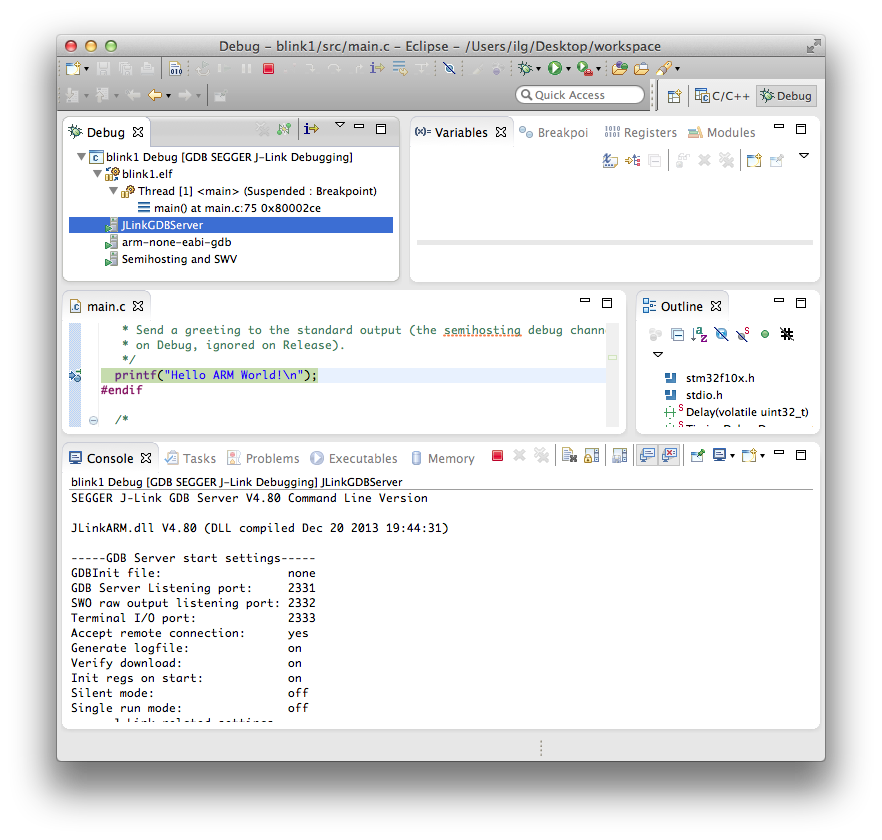
If everything is ok, after a few seconds required to start the server, to allow it to connect to the target, start the gdb client, download the application and start the debugging session, you should see something like this:
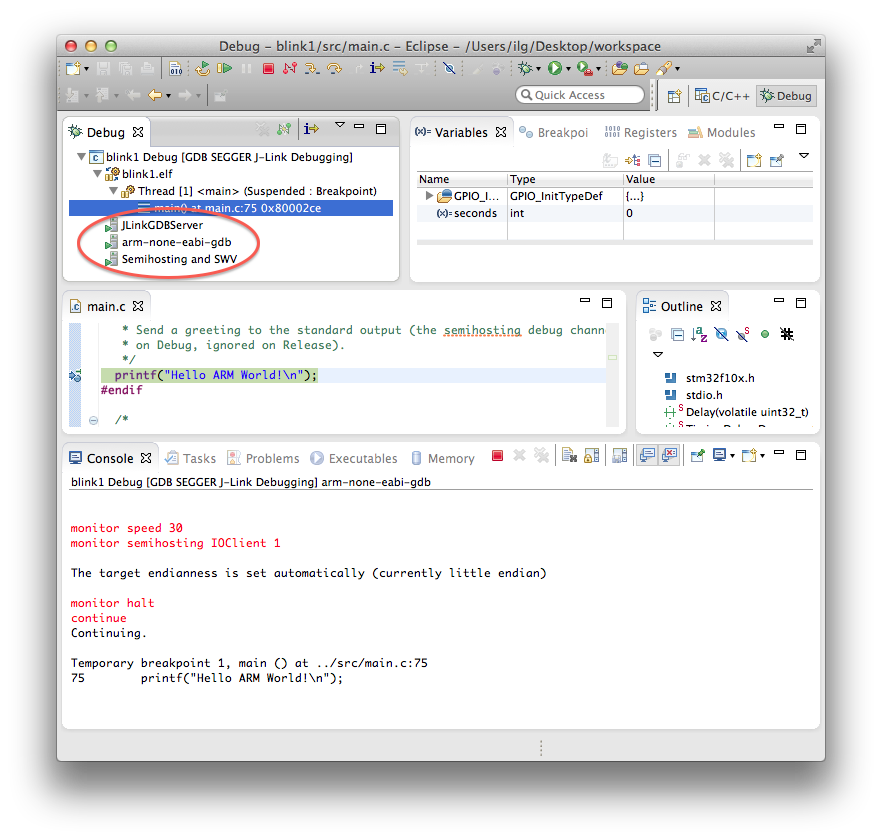
The new debug session, with three consoles.
Since the first breakpoint was set in the Debugger tab to main, the execution stopped right at the beginning of the main() function, which in this case is a tracing printf().
Debug operations
Once the debug session started and execution stopped in the first breakpoint (by default set at the beginning of the main() function), you can perform any debug operation you need.
The most common operations are:
- single step over one source instruction (click the Step Over button)
- single step into the next function called (click the Step Into button)
- single step out of the current function (click the Step Return button)
- set breakpoints (click the grey side area at the left of the source lines)
- run (click the Resume button)
- halt a running program (click the Suspend button)
- inspect processor registers (use the Registers view)
- inspect memory (use the Memory view)
For more details please read the Running and debugging projects section in the Eclipse documentation.
View consoles
Each debug process has a dedicated console, to display its standard output and standard error, or to get input for the standard input.
To see the console of any process, select the process in the top left window. For example the server console might look like this:
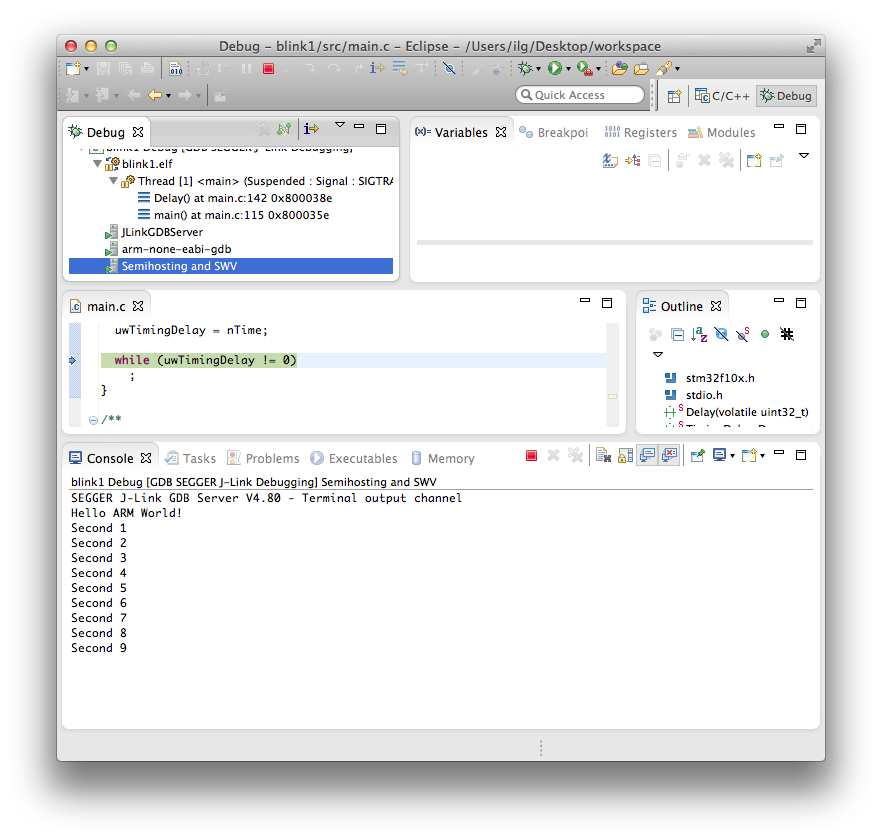
Similarly for the tracing console:
Show console when standard out/error change
This is the default Eclipse behaviour when multiple consoles are active, to automatically switch to the latest updated. In our case, especially when the Semihosting/SWV console is also active, the focus will jump between windows, making things impossible to follow.
This mode can be identified by the status of the buttons on the right side of the Debugging view.
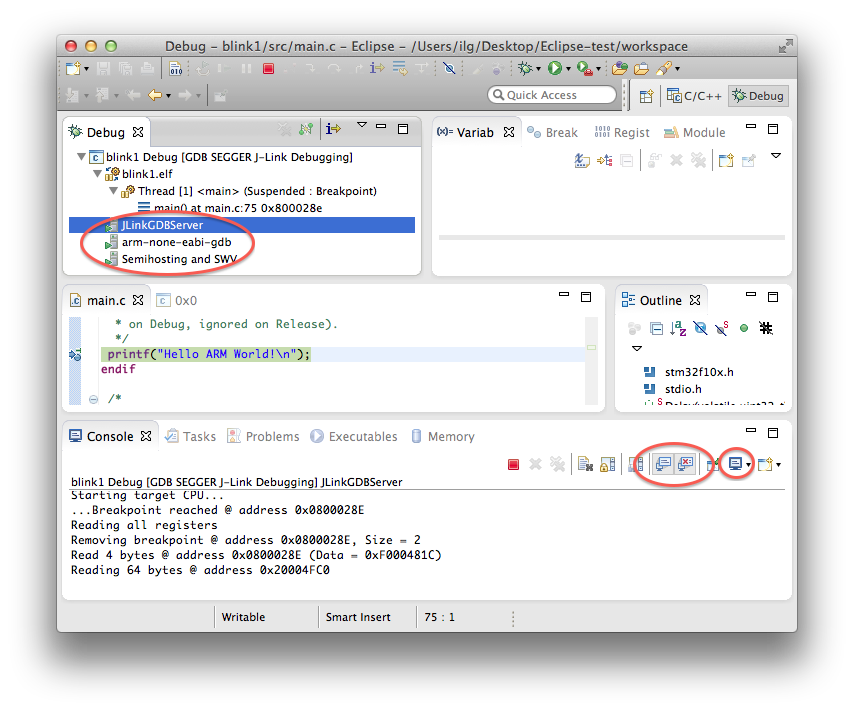
To make the display stable on the desired console, disable both buttons. To switch between consoles, select them either in the top left Debug view, or using the right button, as shown above.
The Restart button
Apparently not a big deal, but quite useful for repeated debug sessions, the Restart button can be used at any time during a debug session, and the result is that a reset is dispatched to the target board via the JTAG/SWD interface and the debug session is restarted.
Note: Due to some bugs in Eclipse, the implementation of his simple button has encountered several problems. Depending on the version you are using, the first time you click this button you might get a message box informing that the button was not enabled. Ignore this message, close the message box and click the button again, this time it’ll be effective.
Using a remote GDB server
If, for any reason, you need to run the GDB server on a remote machine (for example the development board is connected via J-Link to a machine in your office, but you are in another location), you can still use the plug-in to run debugging session. For this to work, just disable Start the GDB server locally in the Debugger tab and instead of localhost for the Host name or IP address, enter the name or address where the GDB server can be accessed.
Then you must manually start the JLinkGDBServer process on the remote machine and only then you can start the debugging session.
Connect to running target
This is an advanced feature, allowing debugging of a target that was started outside the debugger.
To make this possible, enable the Connect to running target option in the Debugger tab:
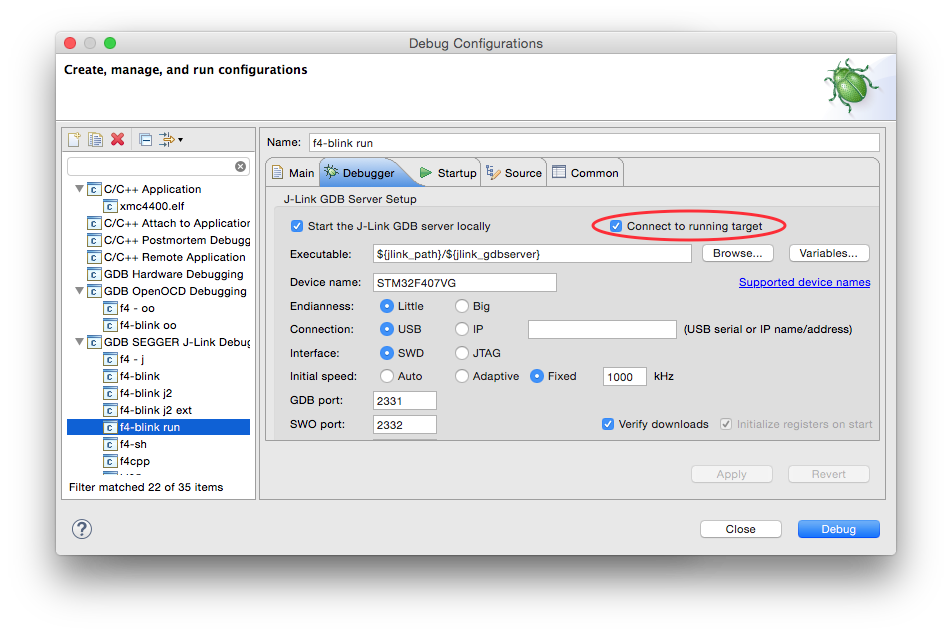
With this option, the J-Link plug-in will no longer reset the target and will no longer download the code into the target’s memory, leaving the target virtually unaffected, even after the debug session is started.
To start interacting with the target, it must be halted, using the debugger’s Halt command. After examining the target’s memory, setting breakpoints, etc, execution can be resumed, and the debug session terminated, leaving the target running.
Using multiple J-Link probes at once
For advanced applications it is sometimes required to start multiple debug sessions, with multiple J-Link probes, on the same computer. SEGGER J-Link is perfectly capable of doing this, both over USB or TCP/IP.
For this, multiple instances of Eclipse are required, and each one must be configured with different TCP/IP ports for the GDB/SWO/Telnet services, and also each must be configured with the serial number of the specific J-Link probe, printed on the back of the probe. For TCP/IP connected J-Link, instead of the serial number, use the IP address.
No GDB initialisation files loaded
For having a total control of the debugging session, the debugging plug-ins start the GDB client process with the --nx option, which prevents the execution of the commands found in any initialization file; none of the standard files (system.gdbinit, ~/.gdbinit, ./.gdbinit) are loaded.
To add more commands to the GDB initialisation sequence, use the Commands: field in the GDB Client Setup section:
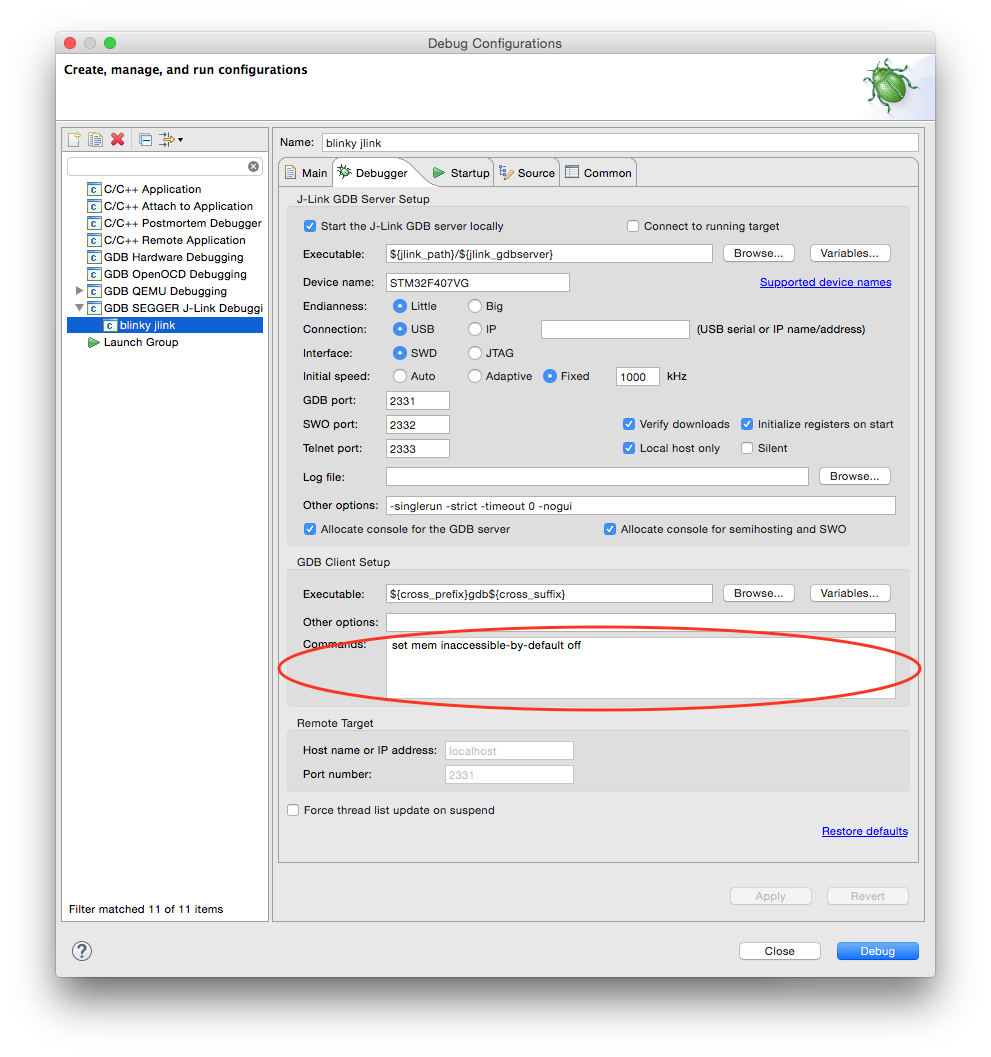
All commands listed here are passed to the GDB client. By convention, commands prefixed with mon will be further passed from the GDB client to the GDB server, in this case the J-Link GDB server.
Troubleshooting
Missing or wrong jlink_path
The first failure to start a debug session is missing to enter the J-Link path. Without it, the launching sequence will complain Cannot run program “/JLinkGDBServer&”.
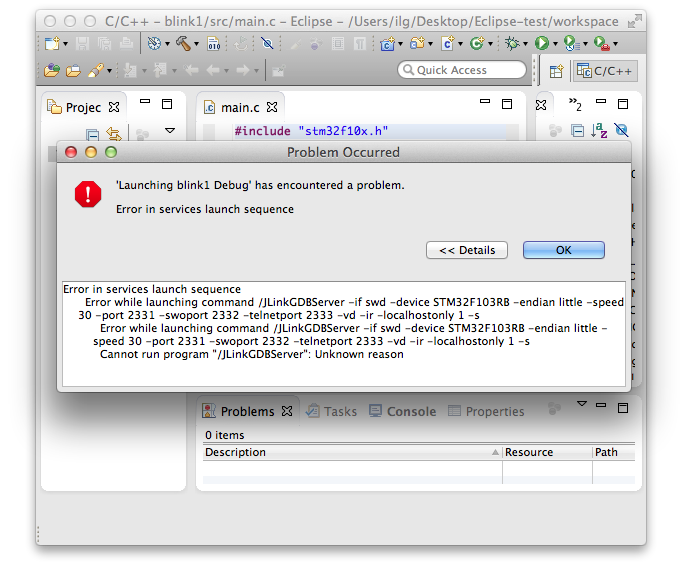
Define the jlink_path as instructed above and the session should start properly.
Wrong device selection
If the devices that you selected in the plug-in does not match the device physically connected, the GDB server session fails and the entire debug session is cancelled. You can identify this case by studying the GDB server log.
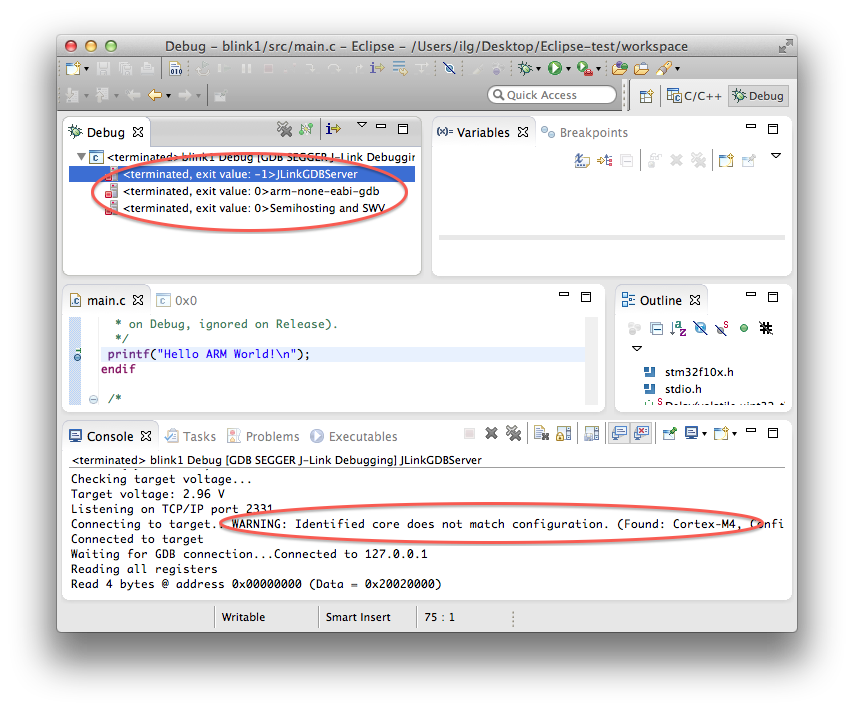
Select the device properly and the session should start properly.
J-Link hangups
Although SEGGER took special measures to avoid J-Link firmware hangups, in case you suspect such a situation (the JLinkGDBServer refuses to connect to the USB device, or to the target), it might help to power cycle the J-Link, by disconnecting and reconnecting the USB cable.
Cannot start applications running from RAM
Please be sure you disable the Pre-run reset and halt option in the Startup tab, this usually does not preserve the RAM content.
Error while launching command: gdb –version
If you kept the GDB client executable defined as ${cross\_prefix}gdb${cross\_suffix}, the above error means that the macros could not be substituted with the correct prefix/suffix. There can be several reasons for this. One might be that you did not associate the debug launcher to a project. Check the Main tab and be sure the field Project: refer to the correct project. Next time when you create the debug configuration, be sure you follow the above suggestions (select .elf, Debug Configurations, double click on GDB SEGGER J-Link Debugging. Another reason is presented below.
Using a different build plug-in or not supported compiler
Another reason for not being able to start the debug session is that your project was not build with the GNU ARM Eclipse managed build plug-in. If you are using another build plug-in, or an exotic/obsolete toolchain, you need to replace ${cross\_prefix}gdb${cross\_suffix} with the actual name of the gdb client available in your toolchain, since the ${cross_*} macros are available only in projects managed by the GNU ARM Eclipse build plug-in.
More info
Although the plug-in takes care of most of the configuration options, and provides reasonable defaults for the usual cases, it is recommended to read the SEGGER manuals, available from the Doc folder in the installation location or directly from the SEGGER J-Link page.
